
Introduction
Snowpack in the western United States serves as a natural reservoir, storing winter precipitation and releasing it gradually through spring and summer. For hikers, skiers, and water managers alike, understanding long-term trends in snowpack is essential for planning and resource management. Here we look at western US snowpack trends.
This analysis examines Snow Water Equivalent (SWE) data from 58 SNOTEL stations across the western U.S., comparing decade-by-decade patterns from the 1980s through the 2020s. The interactive map below allows exploration of individual station trends.
Method
Data Source
Data was obtained from the Natural Resources Conservation Service (NRCS) SNOTEL network, which maintains automated snowpack monitoring stations throughout the western United States. Only stations with continuous records beginning before 1985 were included, ensuring at least 40 years of data for each location.
Water Year Format
All data was organized by water year rather than calendar year. A water year runs from October 1 through September 30, capturing complete snow accumulation and melt cycles. For example, Water Year 2024 spans October 1, 2023 through September 30, 2024.
Decade Assignment
Each water year was assigned to its corresponding decade based on the year in which the water year ends:
- 1980s: Water Years 1980–1989
- 1990s: Water Years 1990–1999
- 2000s: Water Years 2000–2009
- 2010s: Water Years 2010–2019
- 2020s: Water Years 2020–2025
Median Calculation
For each decade, a median SWE curve was calculated by taking the median value for each day of the water year across all years in that decade. Using the median rather than the mean reduces the influence of outlier years (exceptionally high or low snowpack seasons) and provides a more representative picture of typical conditions.
Trend Metric
The primary trend metric compares peak median SWE between the earliest and most recent decades with sufficient data. The formula:
Trend % = ((Latest Decade Peak − Earliest Decade Peak) / Earliest Decade Peak) × 100
For most stations, this compares the 1980s peak to the 2020s peak.
Classification
Stations were classified into five categories based on their trend percentage:
- Strong Increase: Greater than +15%
- Slight Increase: +5% to +15%
- Stable: −5% to +5%
- Slight Decrease: −5% to −15%
- Strong Decrease: Greater than −15%
Results
Overall Trends
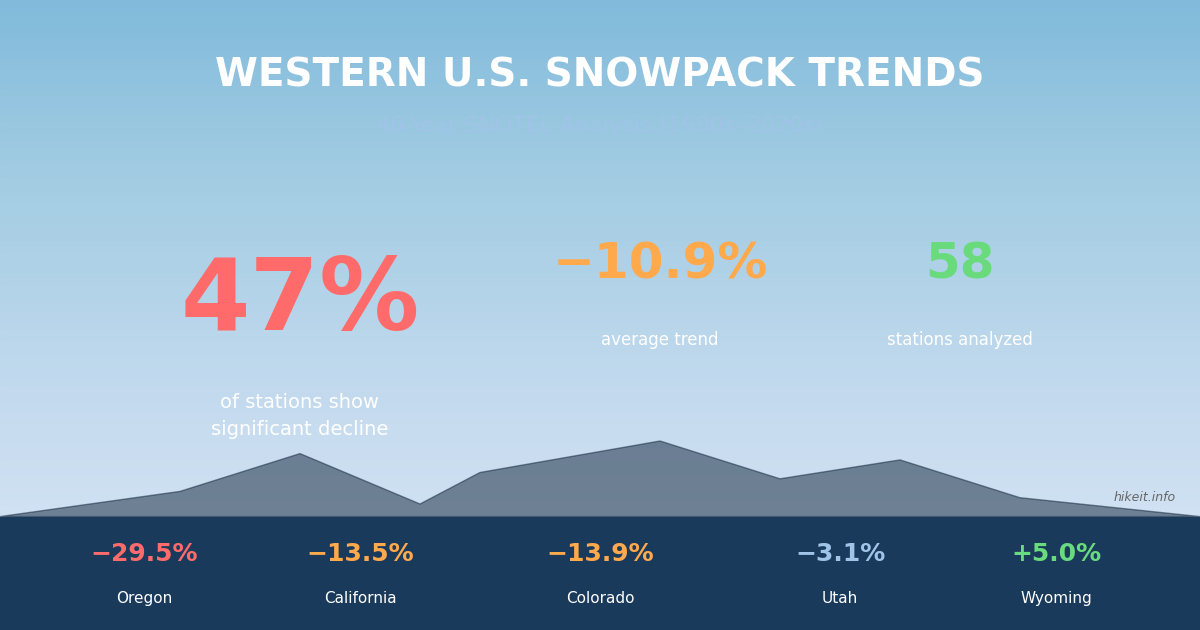
Of the 58 stations analyzed:
| Classification | Count | Percentage |
|---|---|---|
| Strong Decrease (>−15%) | 27 | 46.6% |
| Slight Decrease (−5% to −15%) | 8 | 13.8% |
| Stable (±5%) | 9 | 15.5% |
| Slight Increase (+5% to +15%) | 9 | 15.5% |
| Strong Increase (>+15%) | 5 | 8.6% |
The overall average trend across all stations was −10.9%, with a median of −12.1%.
Regional Patterns
Trends varied substantially by region:
| State | Average Trend | Stations |
|---|---|---|
| Oregon | −29.5% | 7 |
| New Mexico | −31.8% | 2 |
| Idaho | −25.4% | 2 |
| Colorado | −13.9% | 12 |
| California | −13.5% | 11 |
| Nevada | −8.4% | 2 |
| Montana | −5.6% | 3 |
| Utah | −3.1% | 6 |
| Washington | +3.3% | 7 |
| Wyoming | +5.0% | 6 |
Stations with Largest Declines
- Hogg Pass, OR (4,790 ft): −52.8%
- Park Reservoir, CO (10,200 ft): −41.3%
- Three Creeks Meadow, OR (5,680 ft): −41.0%
- Stampede Pass, WA (3,880 ft): −38.2%
- Leavitt Meadows, CA (7,150 ft): −36.2%
Stations with Largest Increases
- Kendall RS, WY (7,740 ft): +39.8%
- Sylvan Lake, WY (8,440 ft): +34.1%
- Harts Pass, WA (6,200 ft): +25.2%
- Sonora Pass, CA (9,180 ft): +20.8%
- Paradise, WA (5,427 ft): +19.0%
Conclusions
Primary Finding
Nearly half (47%) of the analyzed stations show strong snowpack decline exceeding 15% since the 1980s. When combined with stations showing slight decline, approximately 60% of stations have experienced measurable reductions in peak snowpack.
Geographic Patterns
The Pacific Northwest, particularly Oregon, shows the most consistent and severe declines. Oregon stations averaged a 29.5% reduction in peak SWE, with Hogg Pass losing more than half of its historical snowpack. Mid-elevation Cascade sites appear especially vulnerable.
In contrast, portions of the northern Rocky Mountains show stability or modest gains. Wyoming stations, concentrated around the Greater Yellowstone region, averaged a 5.0% increase. Several Washington stations at higher elevations also showed gains despite the state’s proximity to Oregon.
Elevation Considerations
The data does not show a simple relationship between elevation and trend. Both high-elevation sites (Park Reservoir, CO at 10,200 ft: −41.3%) and lower-elevation sites (Hogg Pass, OR at 4,790 ft: −52.8%) appear among the largest declines. Similarly, stations showing increases span a range of elevations.
Limitations
This analysis has several limitations:
- The 2020s decade includes only five complete water years (2020–2024), making it more sensitive to recent conditions
- Station coverage varies by state, with some regions better represented than others
- SWE measurements do not capture other relevant factors such as snow density, timing of melt, or total precipitation
Implications
For backcountry users, these trends suggest:
- Historical trip reports and guidebook snow information may overestimate current conditions, particularly in Oregon and the southern Cascades
- Route planning in the northern Rockies may be less affected by long-term snowpack changes
- Year-to-year variability remains high—individual seasons can diverge substantially from these median trends
Data source: NRCS National Water and Climate Center, SNOTEL network. Analysis period: Water Years 1980–2025. Map and analysis by Hikeit.info.


