

January was a complete change from December. After a fabulous start to the winter season, with feet of snow on Mount Hood, January was very dry and warm. I got out and hiked some trails that should be completely covered in snow. Trails quickly cleared to about 4’000 feet and the conditions felt more like spring rather than winter. This got me thinking about climate and whether it is changing on Mount Hood. Is it getting Warmer on Mount Hood? Rather than rely on media reports I decided to see if I could find some raw data. That would help validate a position.
NOAA Data

The United States is covered in weather stations. Of course, there has been an explosion in recent years, but there are many reporting stations that have historic data going back a century. The amount of raw data that’s available is tremendous – and it’s all freely available. Much of this data is available through the National Oceanic and Atmospheric Administration, NOAA.

Originally I was looking for data from Timberline lodge, where there is a weather station (TIM59). However, after failing to find this I reached out directly to NOAA. A scientist pointed me in a different direction – the TIM59 weather station has been decommissioned – but there is data for Government Camp, that goes back to 1959. Additionally, I found data for the headwaters for the Bull Run that goes back to 1899. (As an aside the times I have reached out to NOAA or the USGS looking for information, the speed and quality of the replies have been fantastic.)
The available amount of data is also broad, temperature, precipitation, etc. For my curiosity, I decided what I wanted to look at was the maximum reported temperatures in January throughout the years and see if there is a trend.
The data sets are large, so there was a little bit of work to do in Excel to parse the data down and produce the graph results.
Data From Government Camp
The data from Govy spans from 1952 to the end of 2021. From this data, I took the maximum temperature readings for each day in January across the years – which spans 69 years. My initial graph was January’s daily high temperatures.

Not a lot that you can make from this – too many series. So for the next graph, I took the average maximum January temperature – i.e. all the maximum temperatures in January for a particular year and then averaged them out to give a single average maximum January temperature. This would give a single data series across all the years. On top of that, I added a trending line.
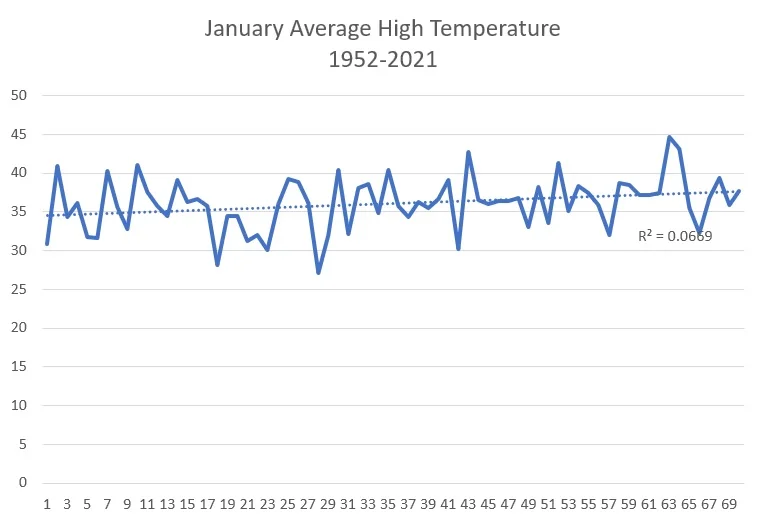
This is a lot more revealing! There are warm years and cooler years. The average hottest year is more recent (2014 – the X-axis is years from 1952). Overall the trend over the 69 years is that the maximum average temperature has increased from just under 35 degrees to around 37.5 degrees – an increase of 2.5 degrees Fahrenheit.
Data From Headwaters of the Bull Run
The data set from the headwaters of the Bull Run – goes back a lot further – to 1899. Having worked out the methodology to create a reasonable graph – I used the same methodology to create a comparative graph of the average maximum January temperature from 1907 to 2021.

As you would expect, it’s slightly warmer. Govy is a good deal higher in elevation than the headwaters of the Bull Run. What’s a bit more noticeable in this graph maximum low temperature seems to be trending up more rapidly. There hasn’t been a maximum low below 35 degrees since 1950. Again the trend over 115 years has been an increase in the average maximum temperature of 5 degrees Fahrenheit. Which seems quite substantial.
I’m sure there is a lot more data available and research that has been done. Sometimes it’s worth looking at some source data so you can draw your own conclusions. Leave a comment if you have any thoughts on this.


